Introducing a new series of article to talk about performance, benchmarking and PrestaShop!
You may have heard of it, but we’ll soon release a White Paper, which is all about PrestaShop’s performance, how to benchmark it and how it behaves under loads. And what to do to keep it responding under 300ms.
Still, there are a number of matters that can’t be covered in a White Paper – hopefully the first in a series, fingers crossed.
Or that can’t be given the space we think they deserve.
Or that we’d just love to shine a light on.
So, we are starting a series of articles to do just that.
But let’s start we performance itself.
Because, funny thing is, we often talk about performance as something we all understand and it is mostly true: we share the same expectations.
Though, we’re not always on line with its implications.
So, here we go!
Performance is subjective
It may seem counter-intuitive coming from a technical environment, either from web development or any other domain, but still performance is all about capabilities.
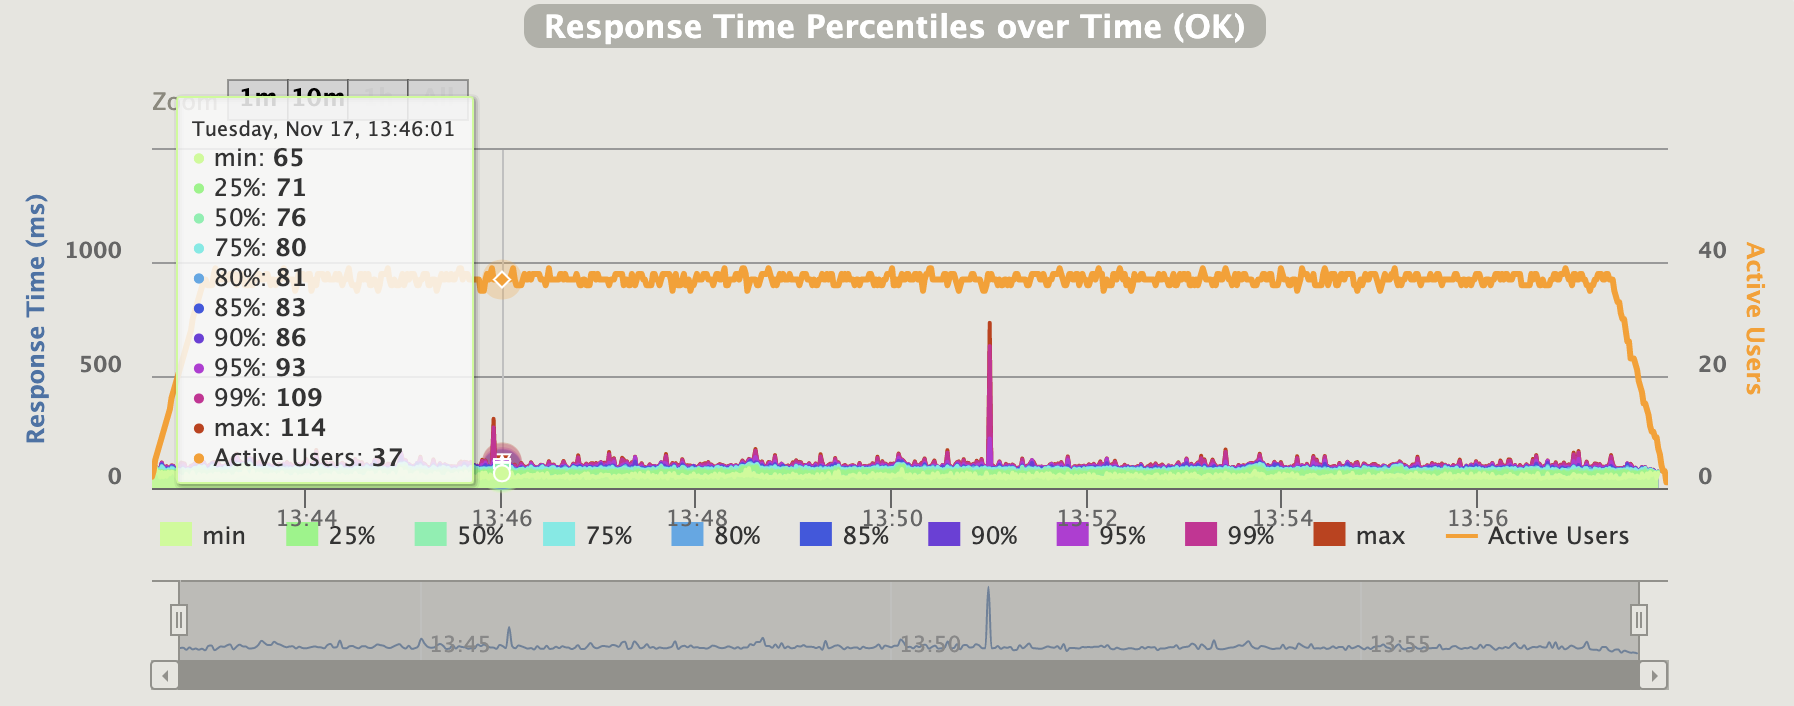
Just to illustrate, let’s have a look at this Gatling graph and the active users:
 So many numbers with Gatling
Is it high? Or is it low? But compared to what? In which context?
Same thing, if I’m told that in a GCP environment, the maximum write sustained IOPS per GB for a regional SSD drive is 30: does it mean it performs? Is it good or…?
But let’s be even more precise: in our White Paper scope, we assumed a web page should load under 300ms to be deemed acceptable for our users. Hence, we based our benchmarks on this value – and results above this response time where discarded as unacceptable.
Still, 300ms is not telling us anything specific about performance. It’s neither good, nor bad. It’s all a matter of interpretation, analysis and finding what is felt acceptable by our users.
And sticking to it, of course.
At the end of the day, the suitable performance is the one that fulfills your consumers’ expectation.
There’s not “one performance problem”
When you’re dealing with a performance issue, you’re in fact dealing with “the currently visible bottleneck”. And as soon as you’ve managed it, another bottleneck will take its place. Always.
 From Wikipedia with love, CC BY-SA 3.0
Let’s say my application is slow, so I’m analysing it and find out that my crappy hard drive is failing. So I replace it with a newer and faster one.
My application is then less slow, for sure, but still not fast enough: I’ve just removed the first visible bottleneck.
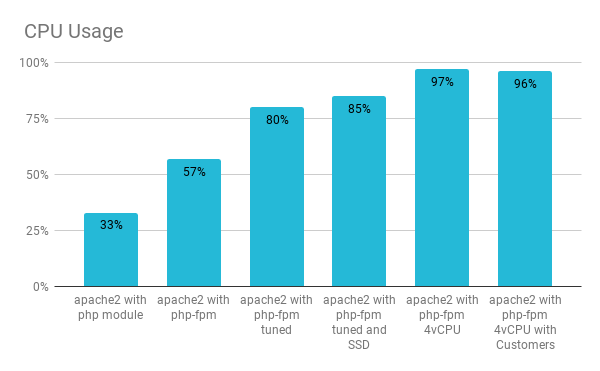
For sure, a new bottleneck just appeared, as I now find out that my CPU is not fast enough.
Now that my disk is quickly sending data to my CPU to be processed, it’s not managing it as fast as I would like.
Funny thing is, once I’ve increased my processing capacity, I may find out that my disk is not fast enough once more. Or maybe that the network, connecting to the database, is throttling my application. And once the network capacity is increased, it can be the database itself. And so on.
You get the drill: a performance issue is “the currently visible bottleneck”.
Performance is a continuous thing
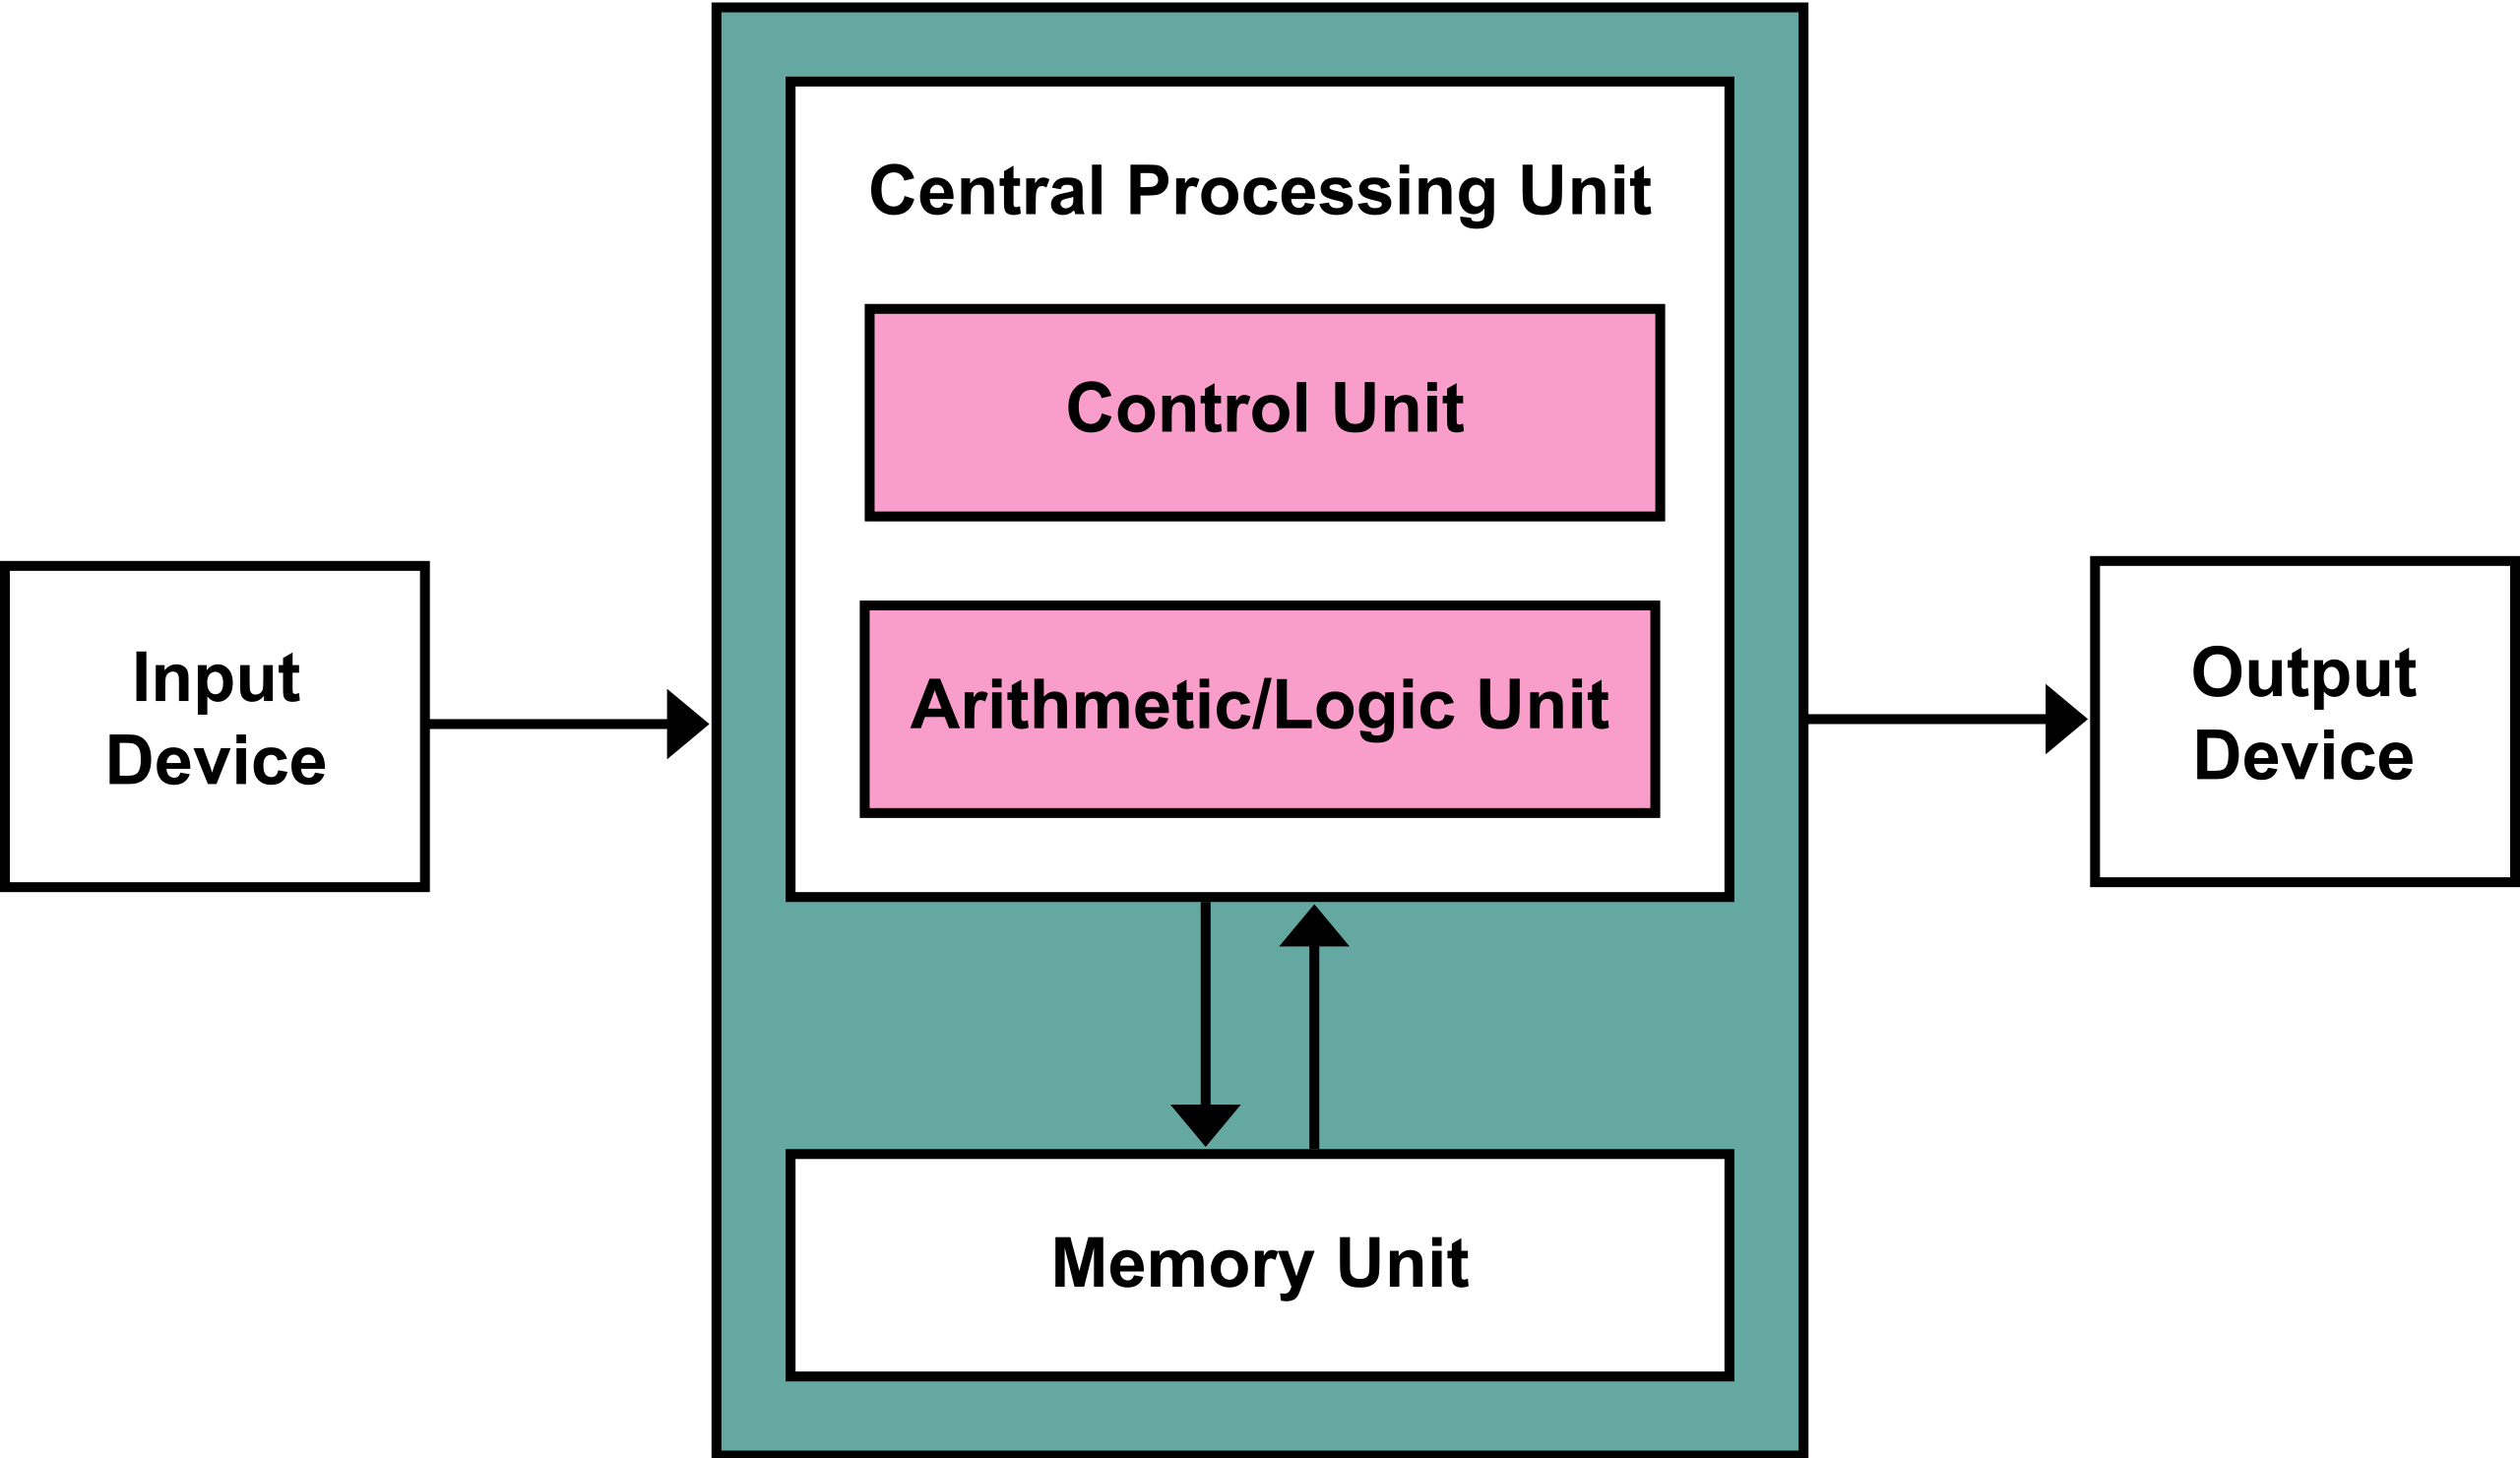
 The processor can perform when it is not slowed down by other parts
As said, performance tuning is about removing bottlenecks, one after the other. Which means at least two things:
- You should only work on one bottleneck at a time in order to evaluate your changes’ impacts
- There will always be a remaining bottleneck
Added to that, either your application or system will evolve over time (data will increase, files will accumulate and network consumption will grow with load), you will need to adjust your tuning, work on different levers as new requirements will appear.
Every enhancement won’t have the same effect (or any) over your system’s life cycle.
Now that we’re all on the same page about the concepts of performance, we are ready to dive into more crunchy details! Prepare yourselves for the next articles in this series, hopefully in the coming weeks!
This post is also available in:
 English


